v0.43.18
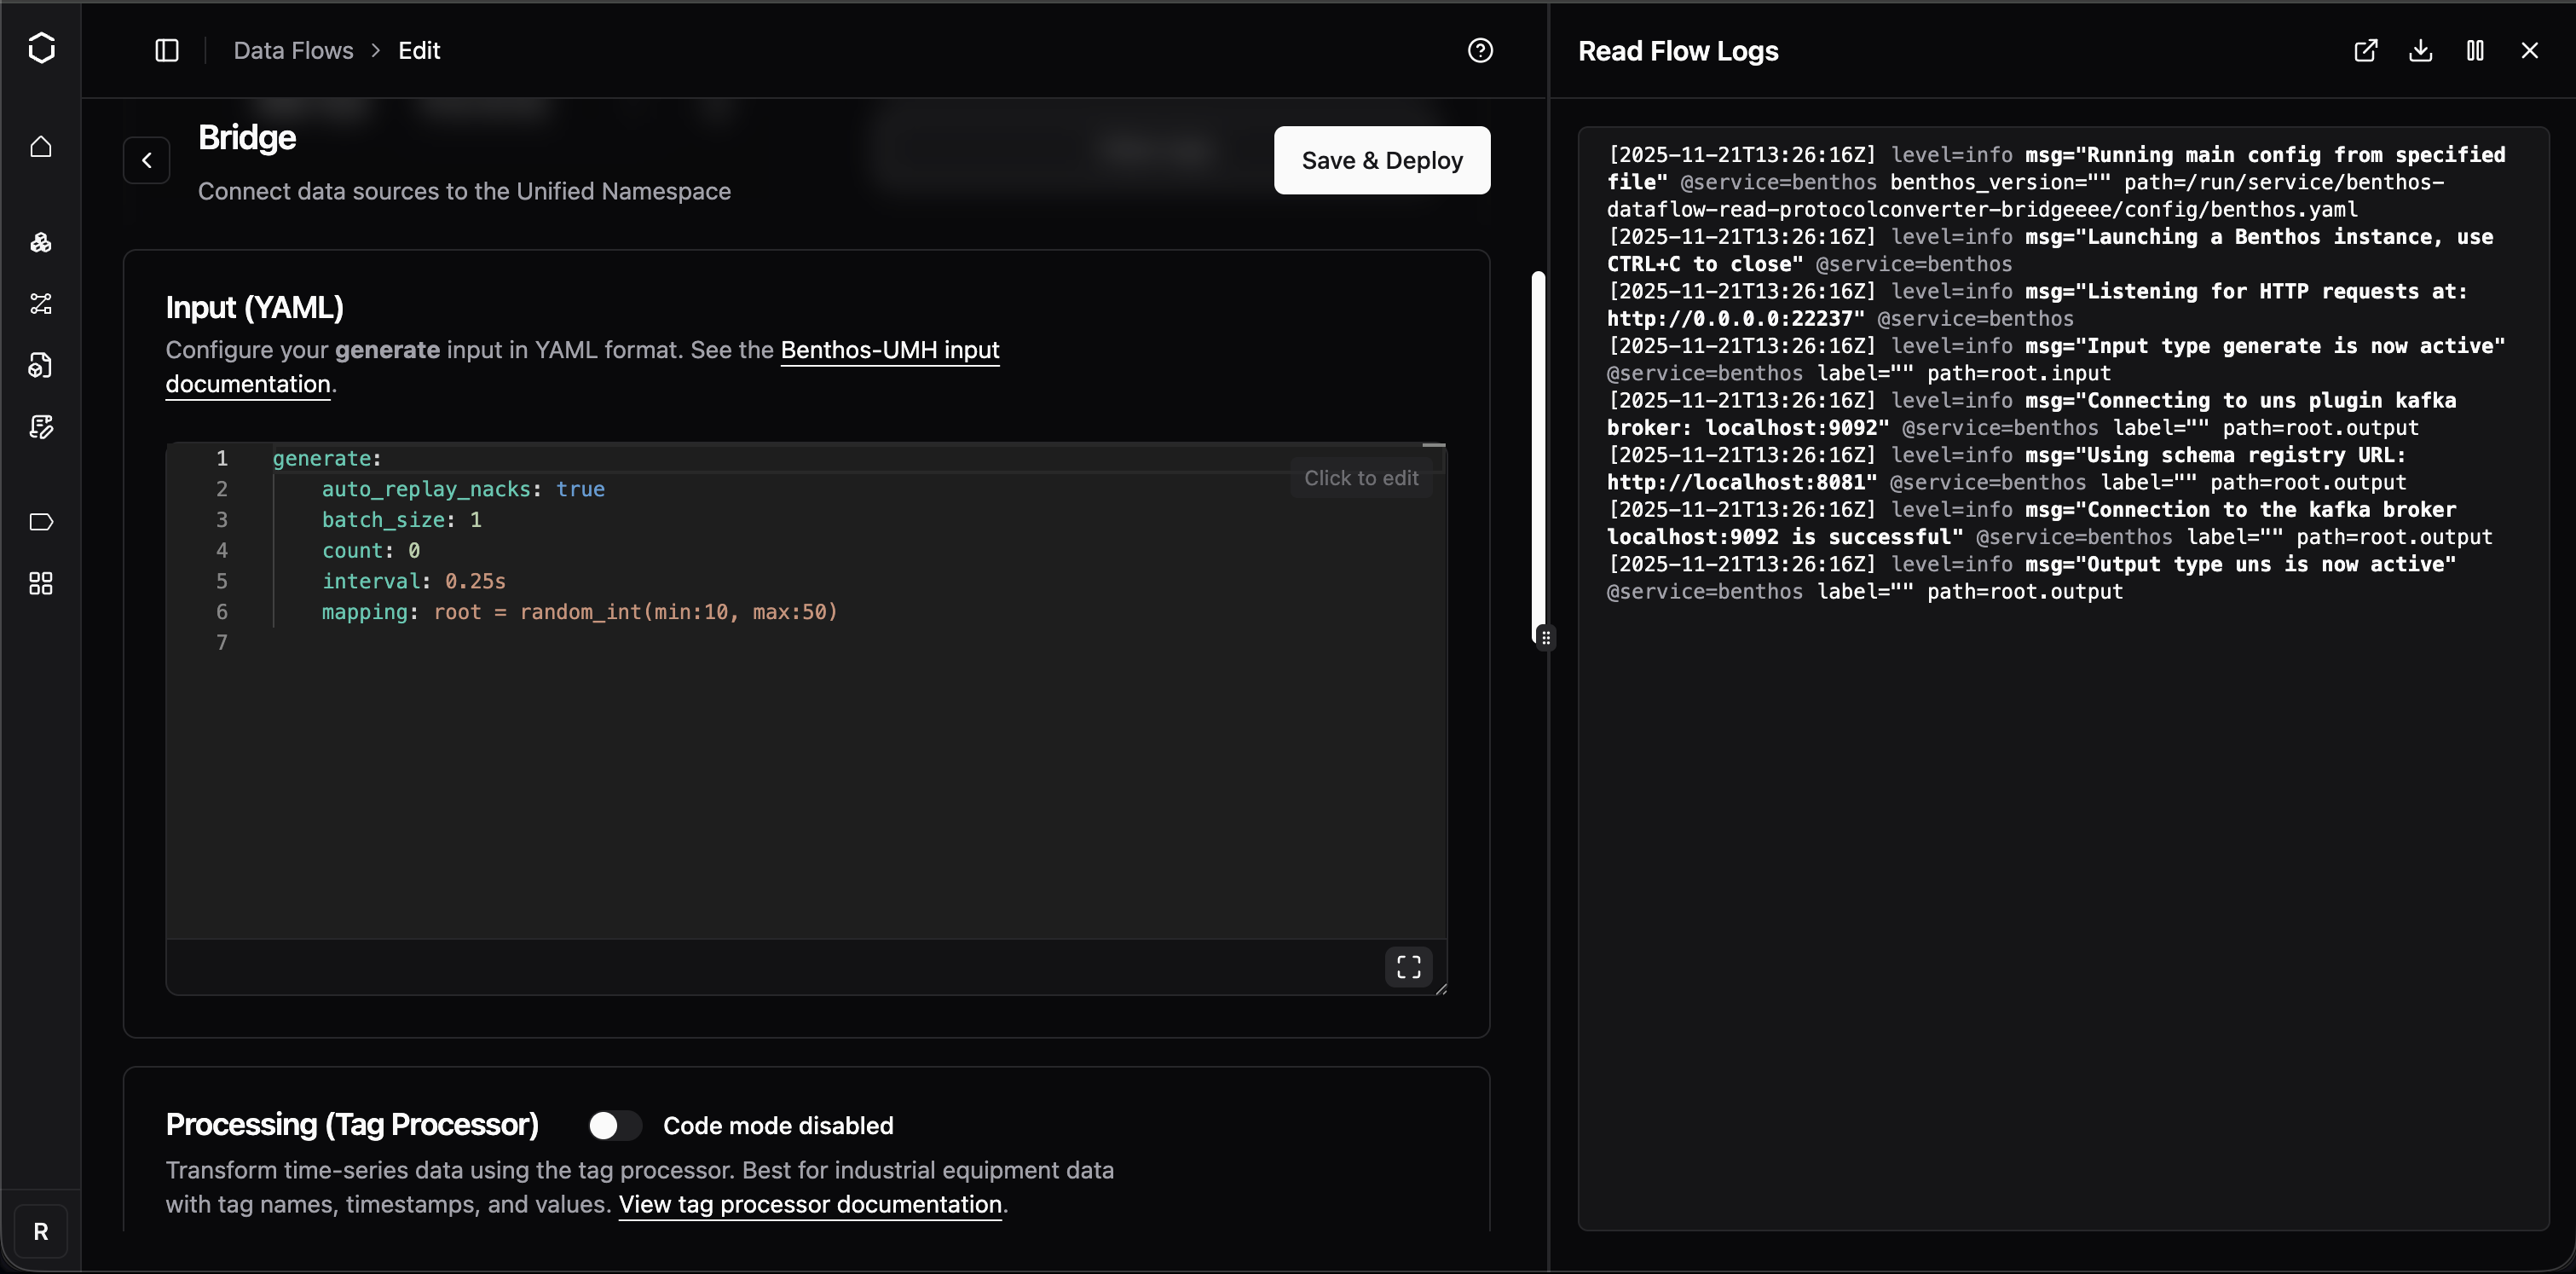
You can now access logs and metrics directly from any data flow component page. Click the "Logs" or "Metrics" button to open a side panel without leaving your current context. The panel appears on-demand instead of cluttering the interface with permanent tabs. Works across bridges, stream processors, and all data flow types.

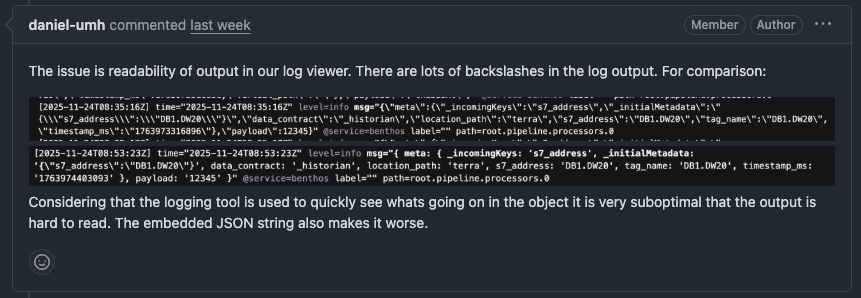
Cleaner JavaScript Debugging Output
Bridge configuration debugging is now significantly easier. Previously, console output from JavaScript processors contained excessive escaped characters, making it difficult to read. The output now uses a Node.js-style representation that's more readable.
OPC UA Subscriptions Without Tag Hierarchy
Fixed an issue where subscribing directly to OPC UA child nodes (without a parent folder hierarchy) would cause validation errors or malformed topics with double dots. Topics are now properly constructed without the optional virtual path segment.
Improvements
- Status alerts and warnings now have a more consistent look with clearer explanations and collapsible technical details
- Buttons across the platform now follow a consistent design pattern with proper visual hierarchy
Fixes
- Delete dialogs now properly close when clicking the X button