Management Console
2026-06-19
New Features
- TimescaleDB Historian bridge template in the Add Bridge wizard: Save data from the UNS into TimescaleDB for a single data model. Values and metadata are stored in TimescaleDB hypertables with compression enabled on deploy, keeping high-volume time-series data compact and fast to query. By default it archives all tag metadata except high-churn transport keys (OPC UA and Sparkplug timestamps, sequence numbers, Kafka record times, and similar) that change on nearly every message and would otherwise bloat the metadata table; you can instead set an explicit list of metadata keys to keep. It is maintained and supported by the UMH team, with the required database setup documented inline in the bridge editor.
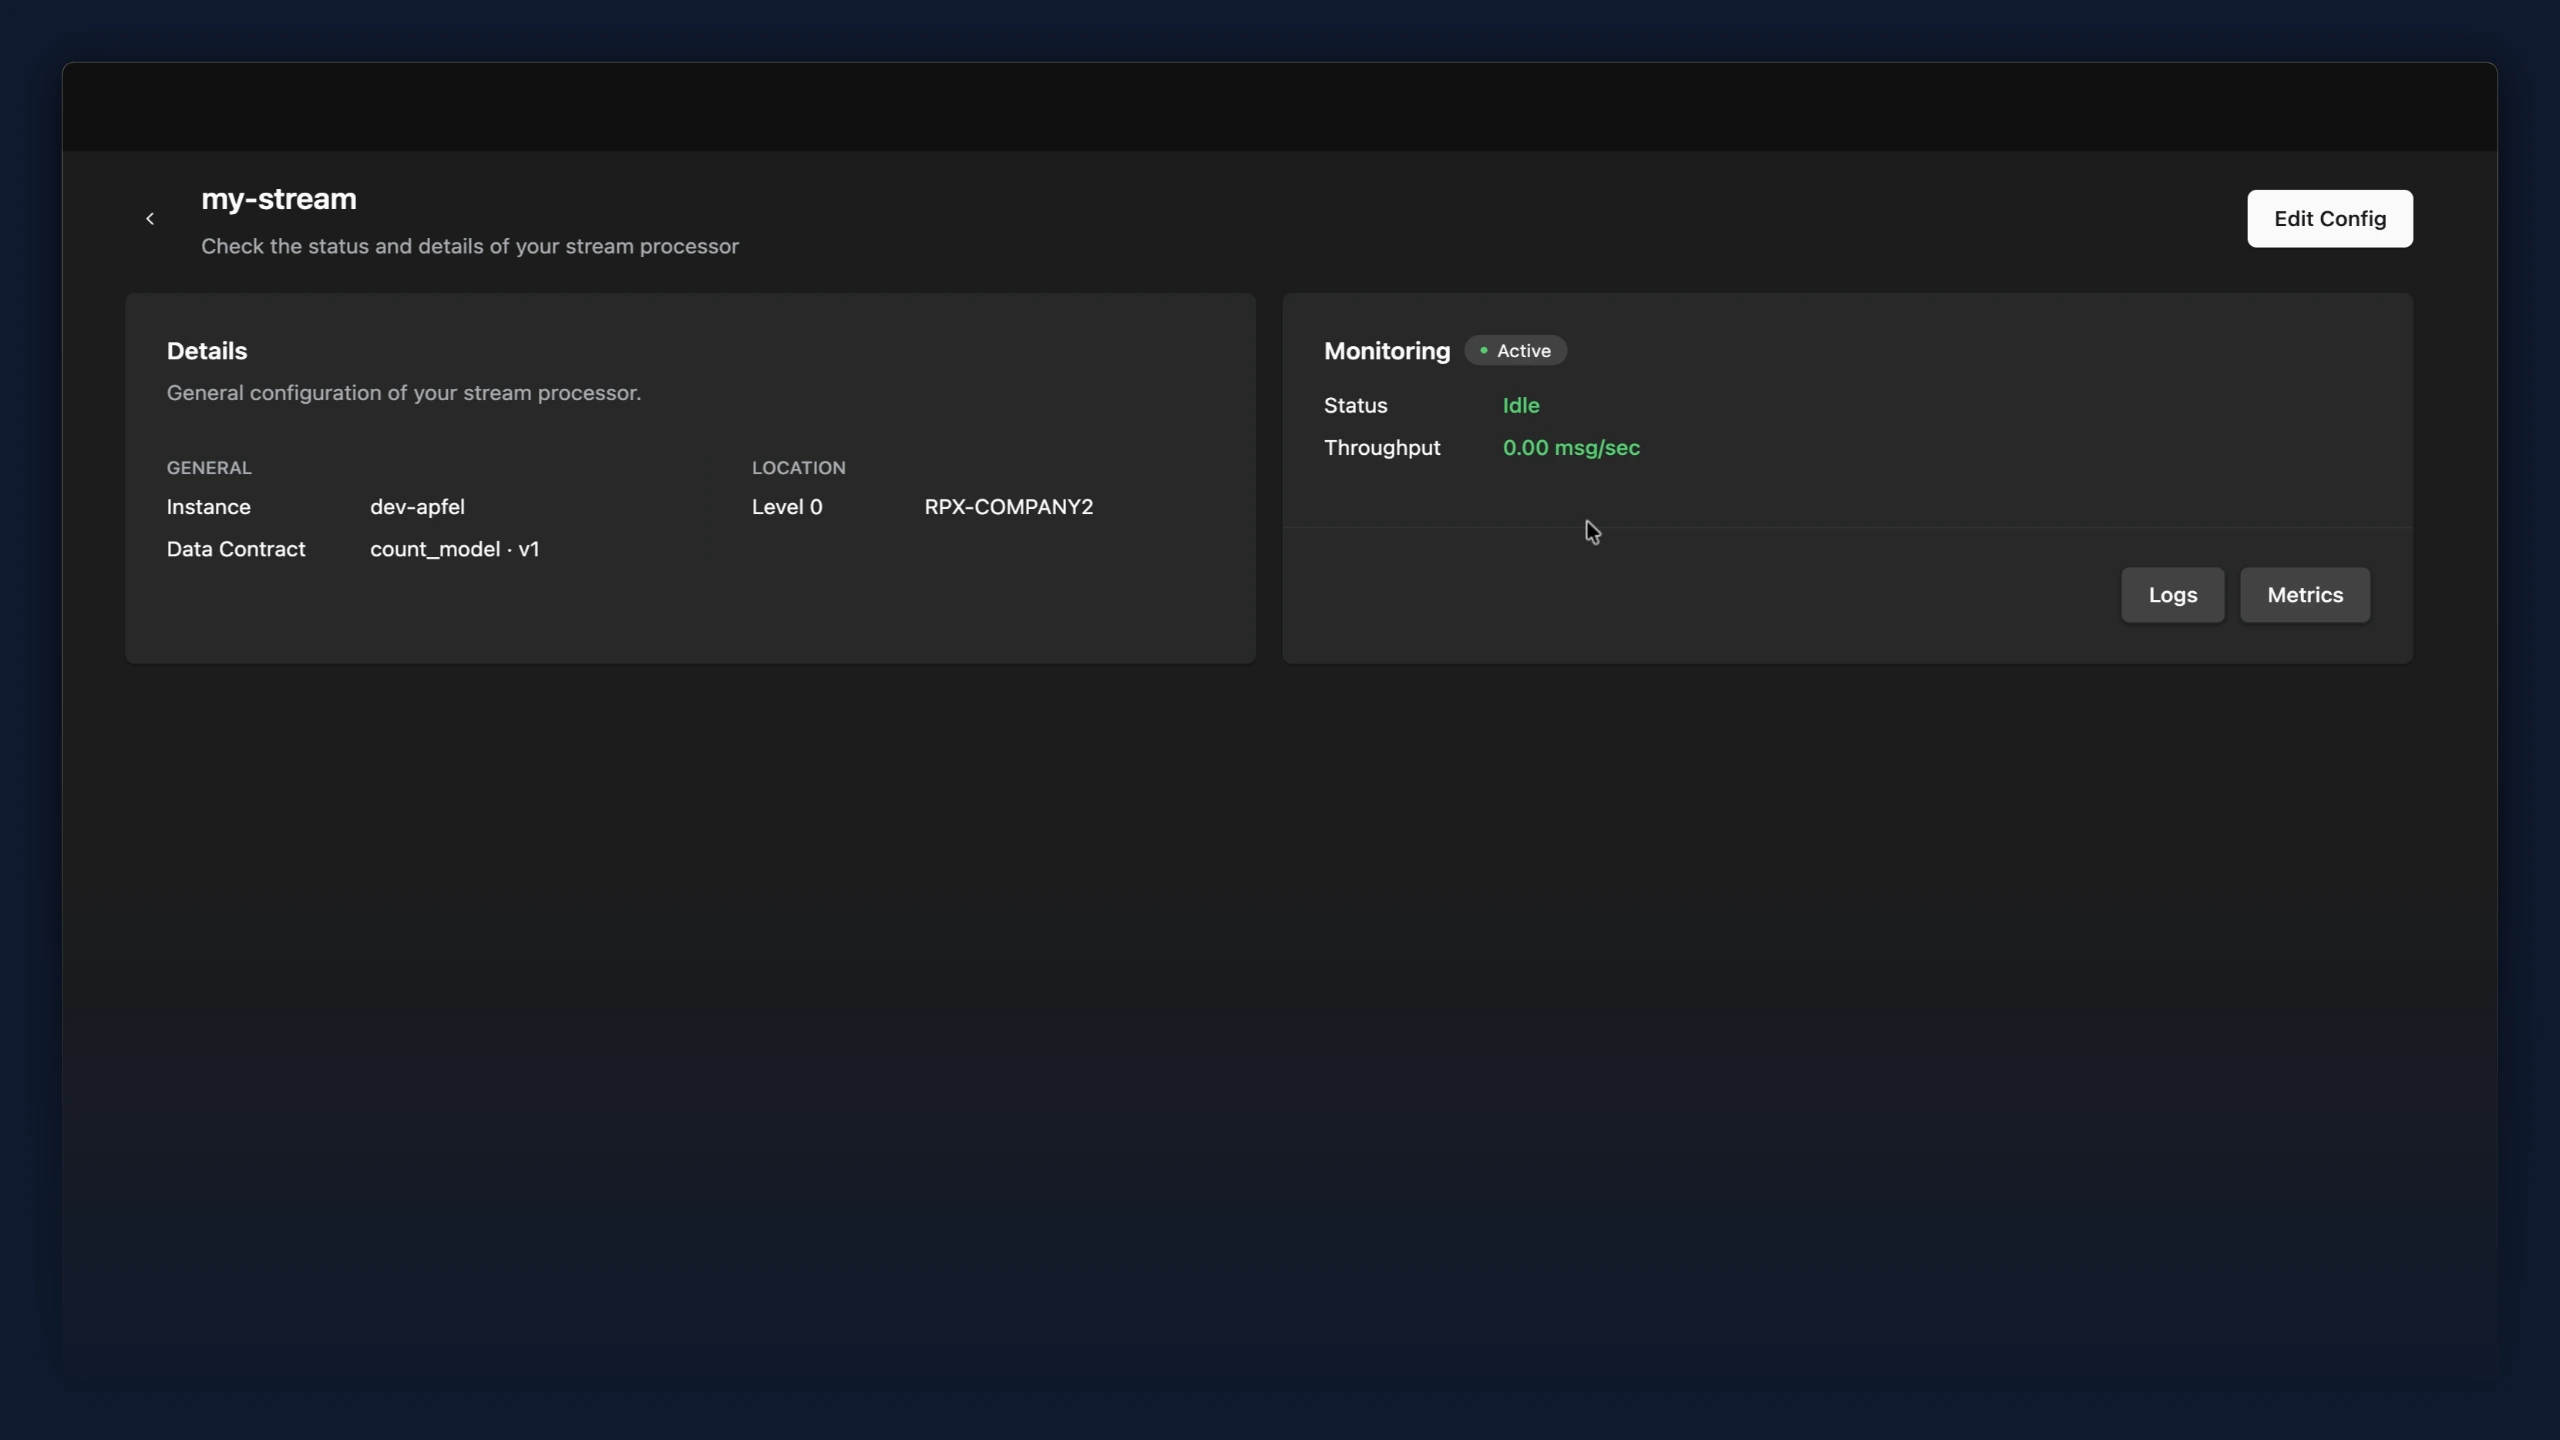
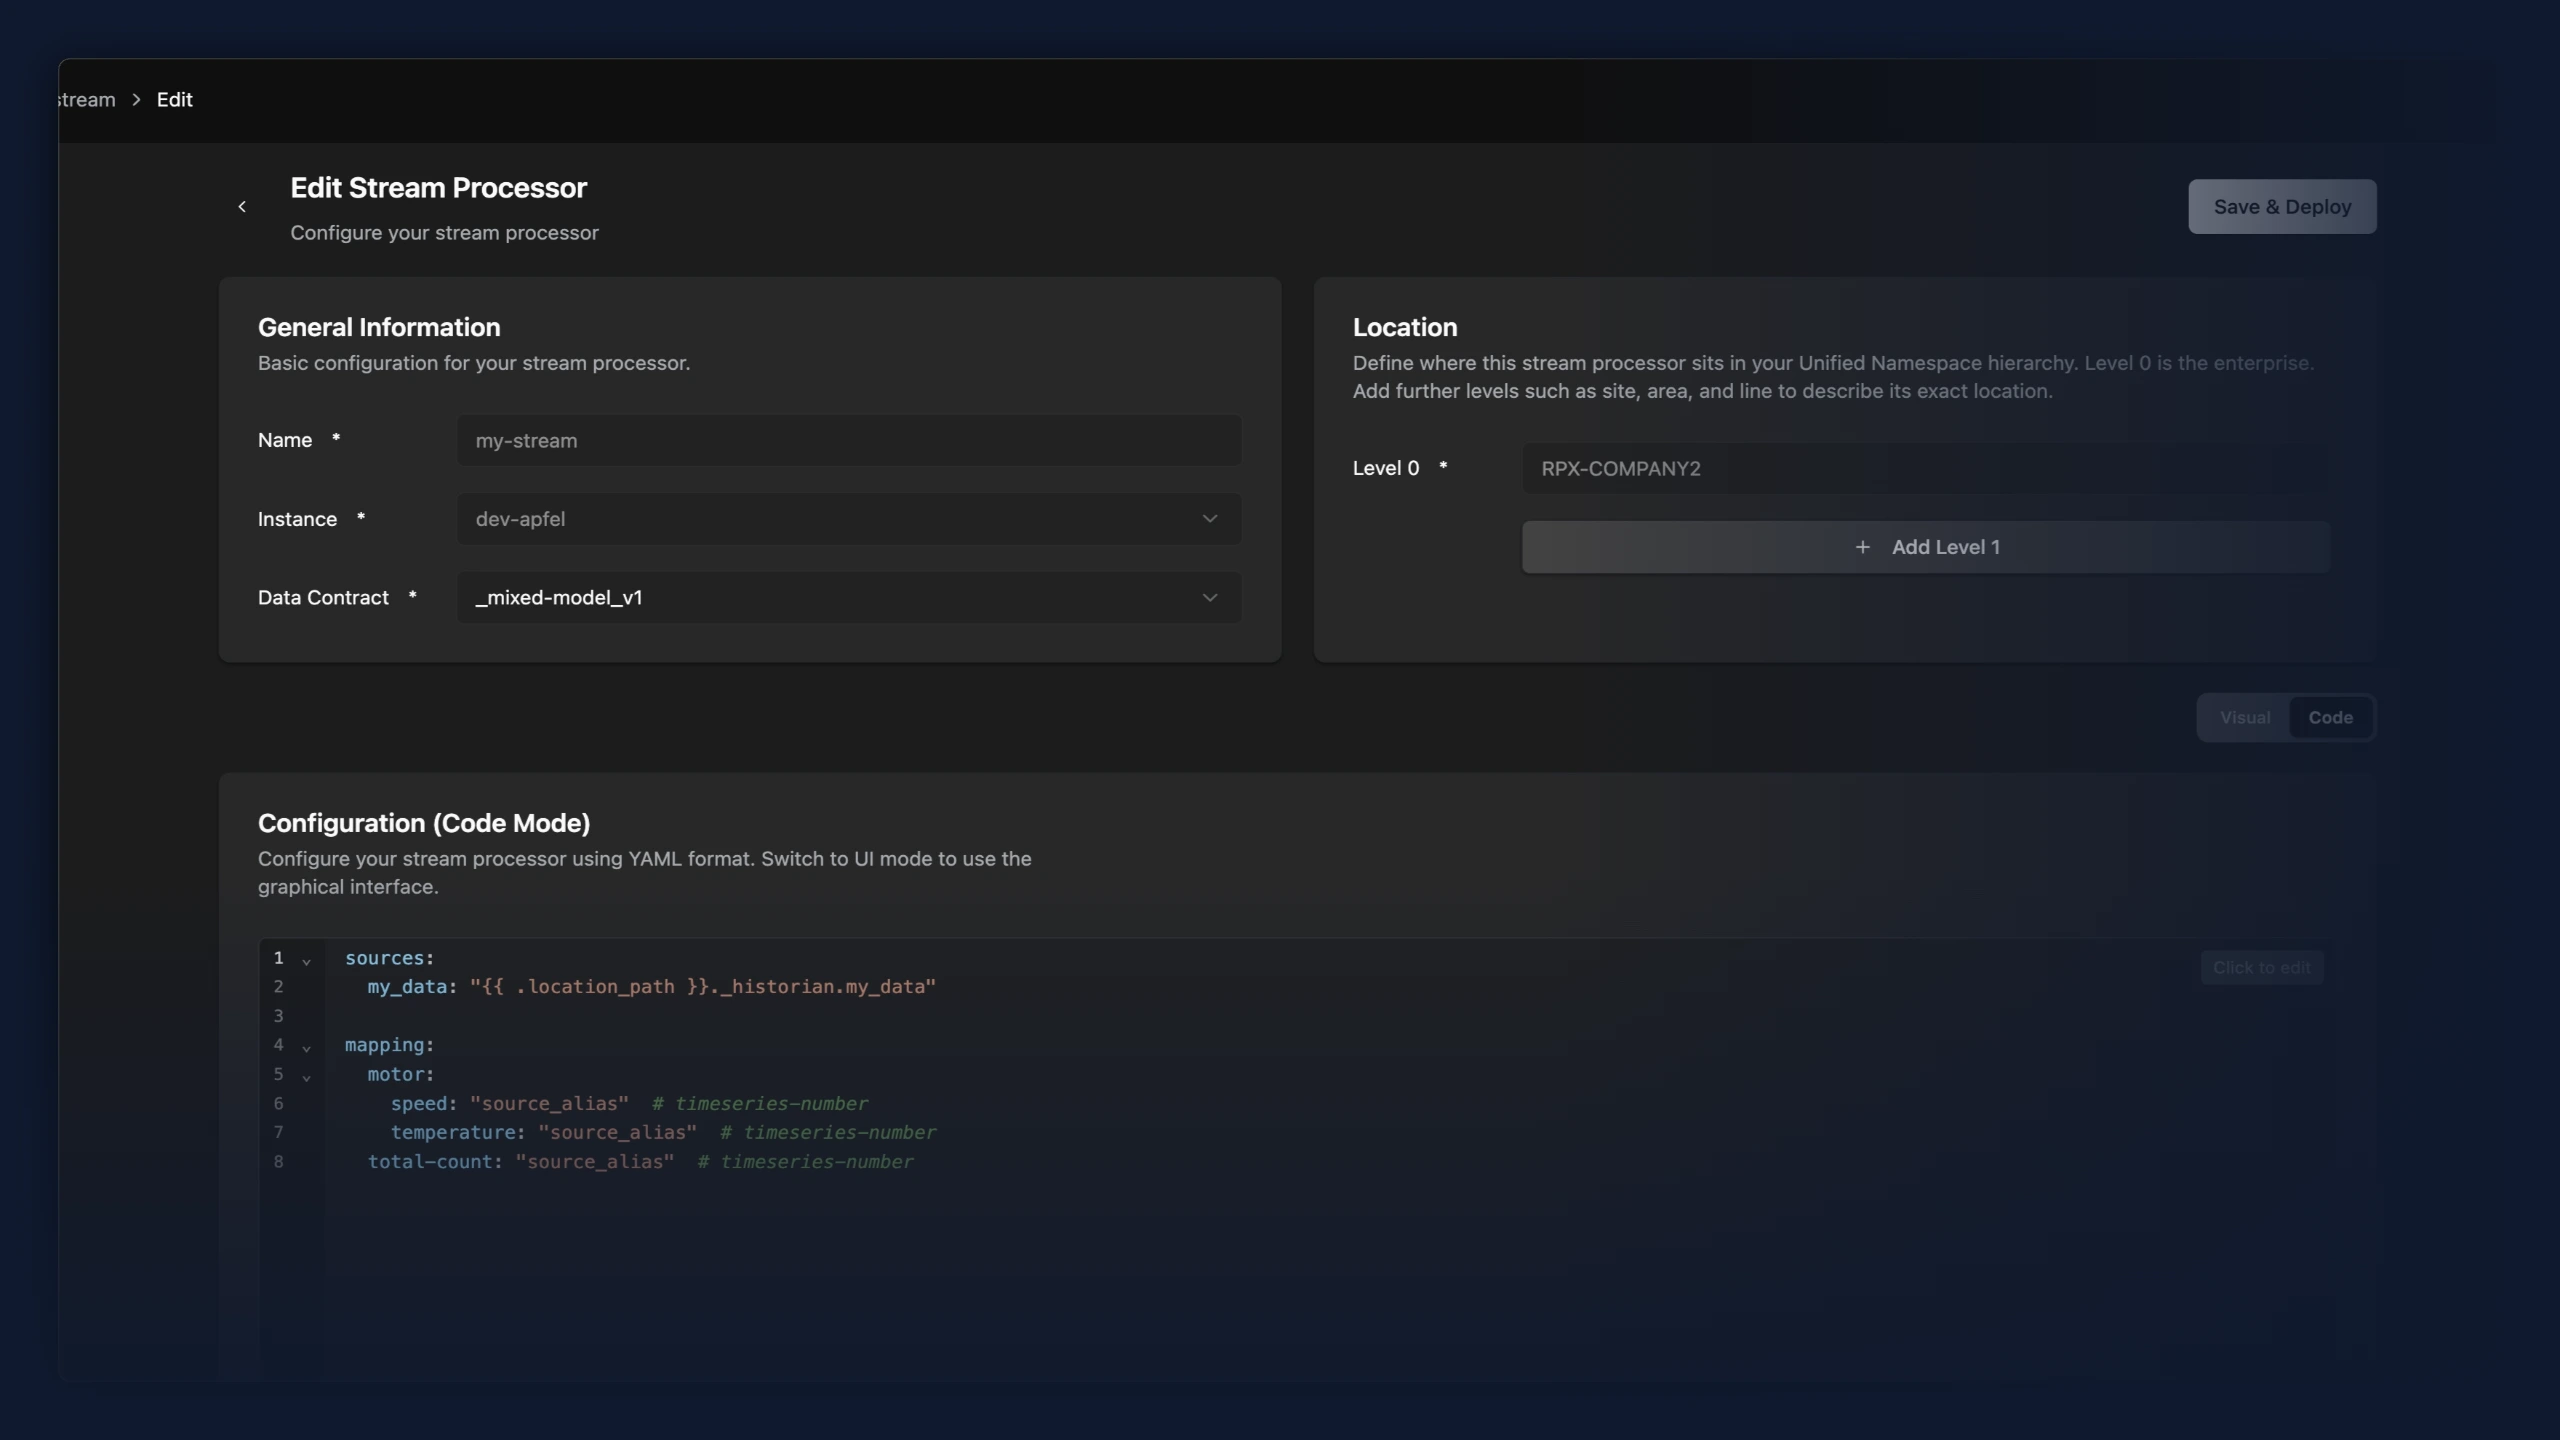
- Stream processors now have an overview page, and the editor has been reworked. Opening a stream processor from the data flow list shows a read-only summary with live monitoring (status, throughput, plus Logs and Metrics) instead of dropping you straight into the editor. A new "Edit Config" button opens the editor. In the editor, the general settings and the UNS location are now split into separate cards, and the code editor fills the available height and scrolls internally instead of stretching the page.
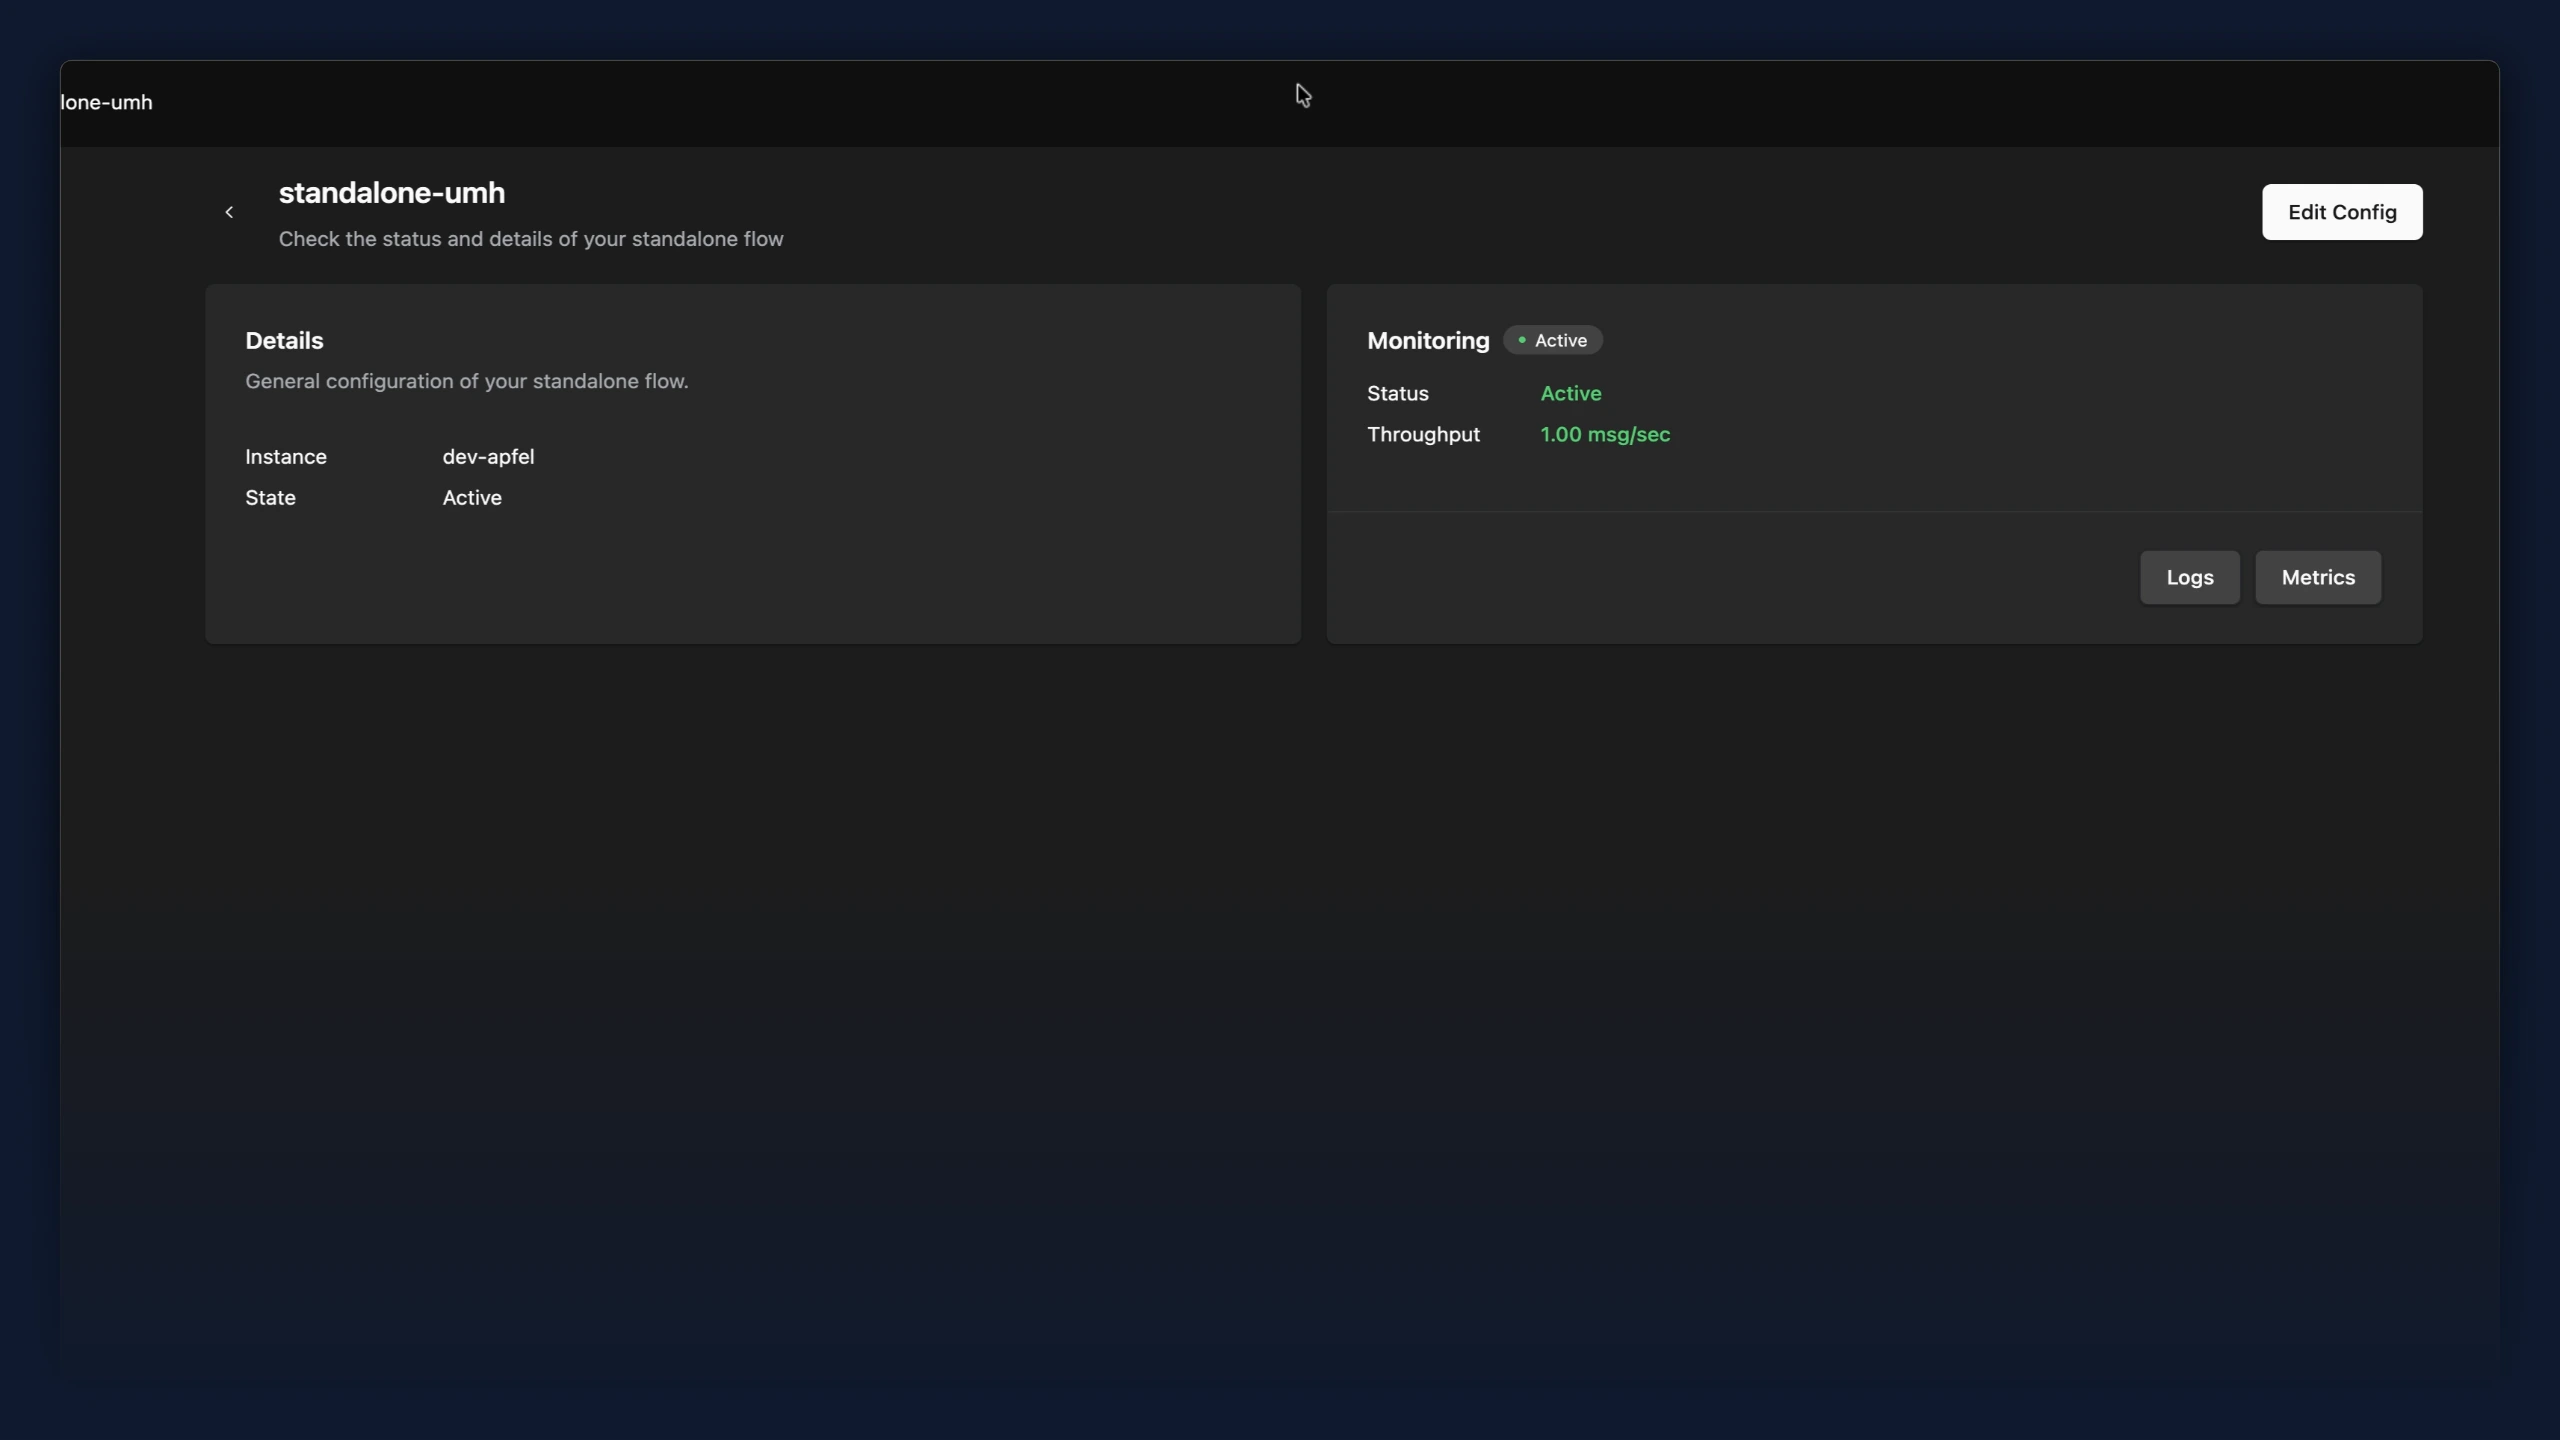
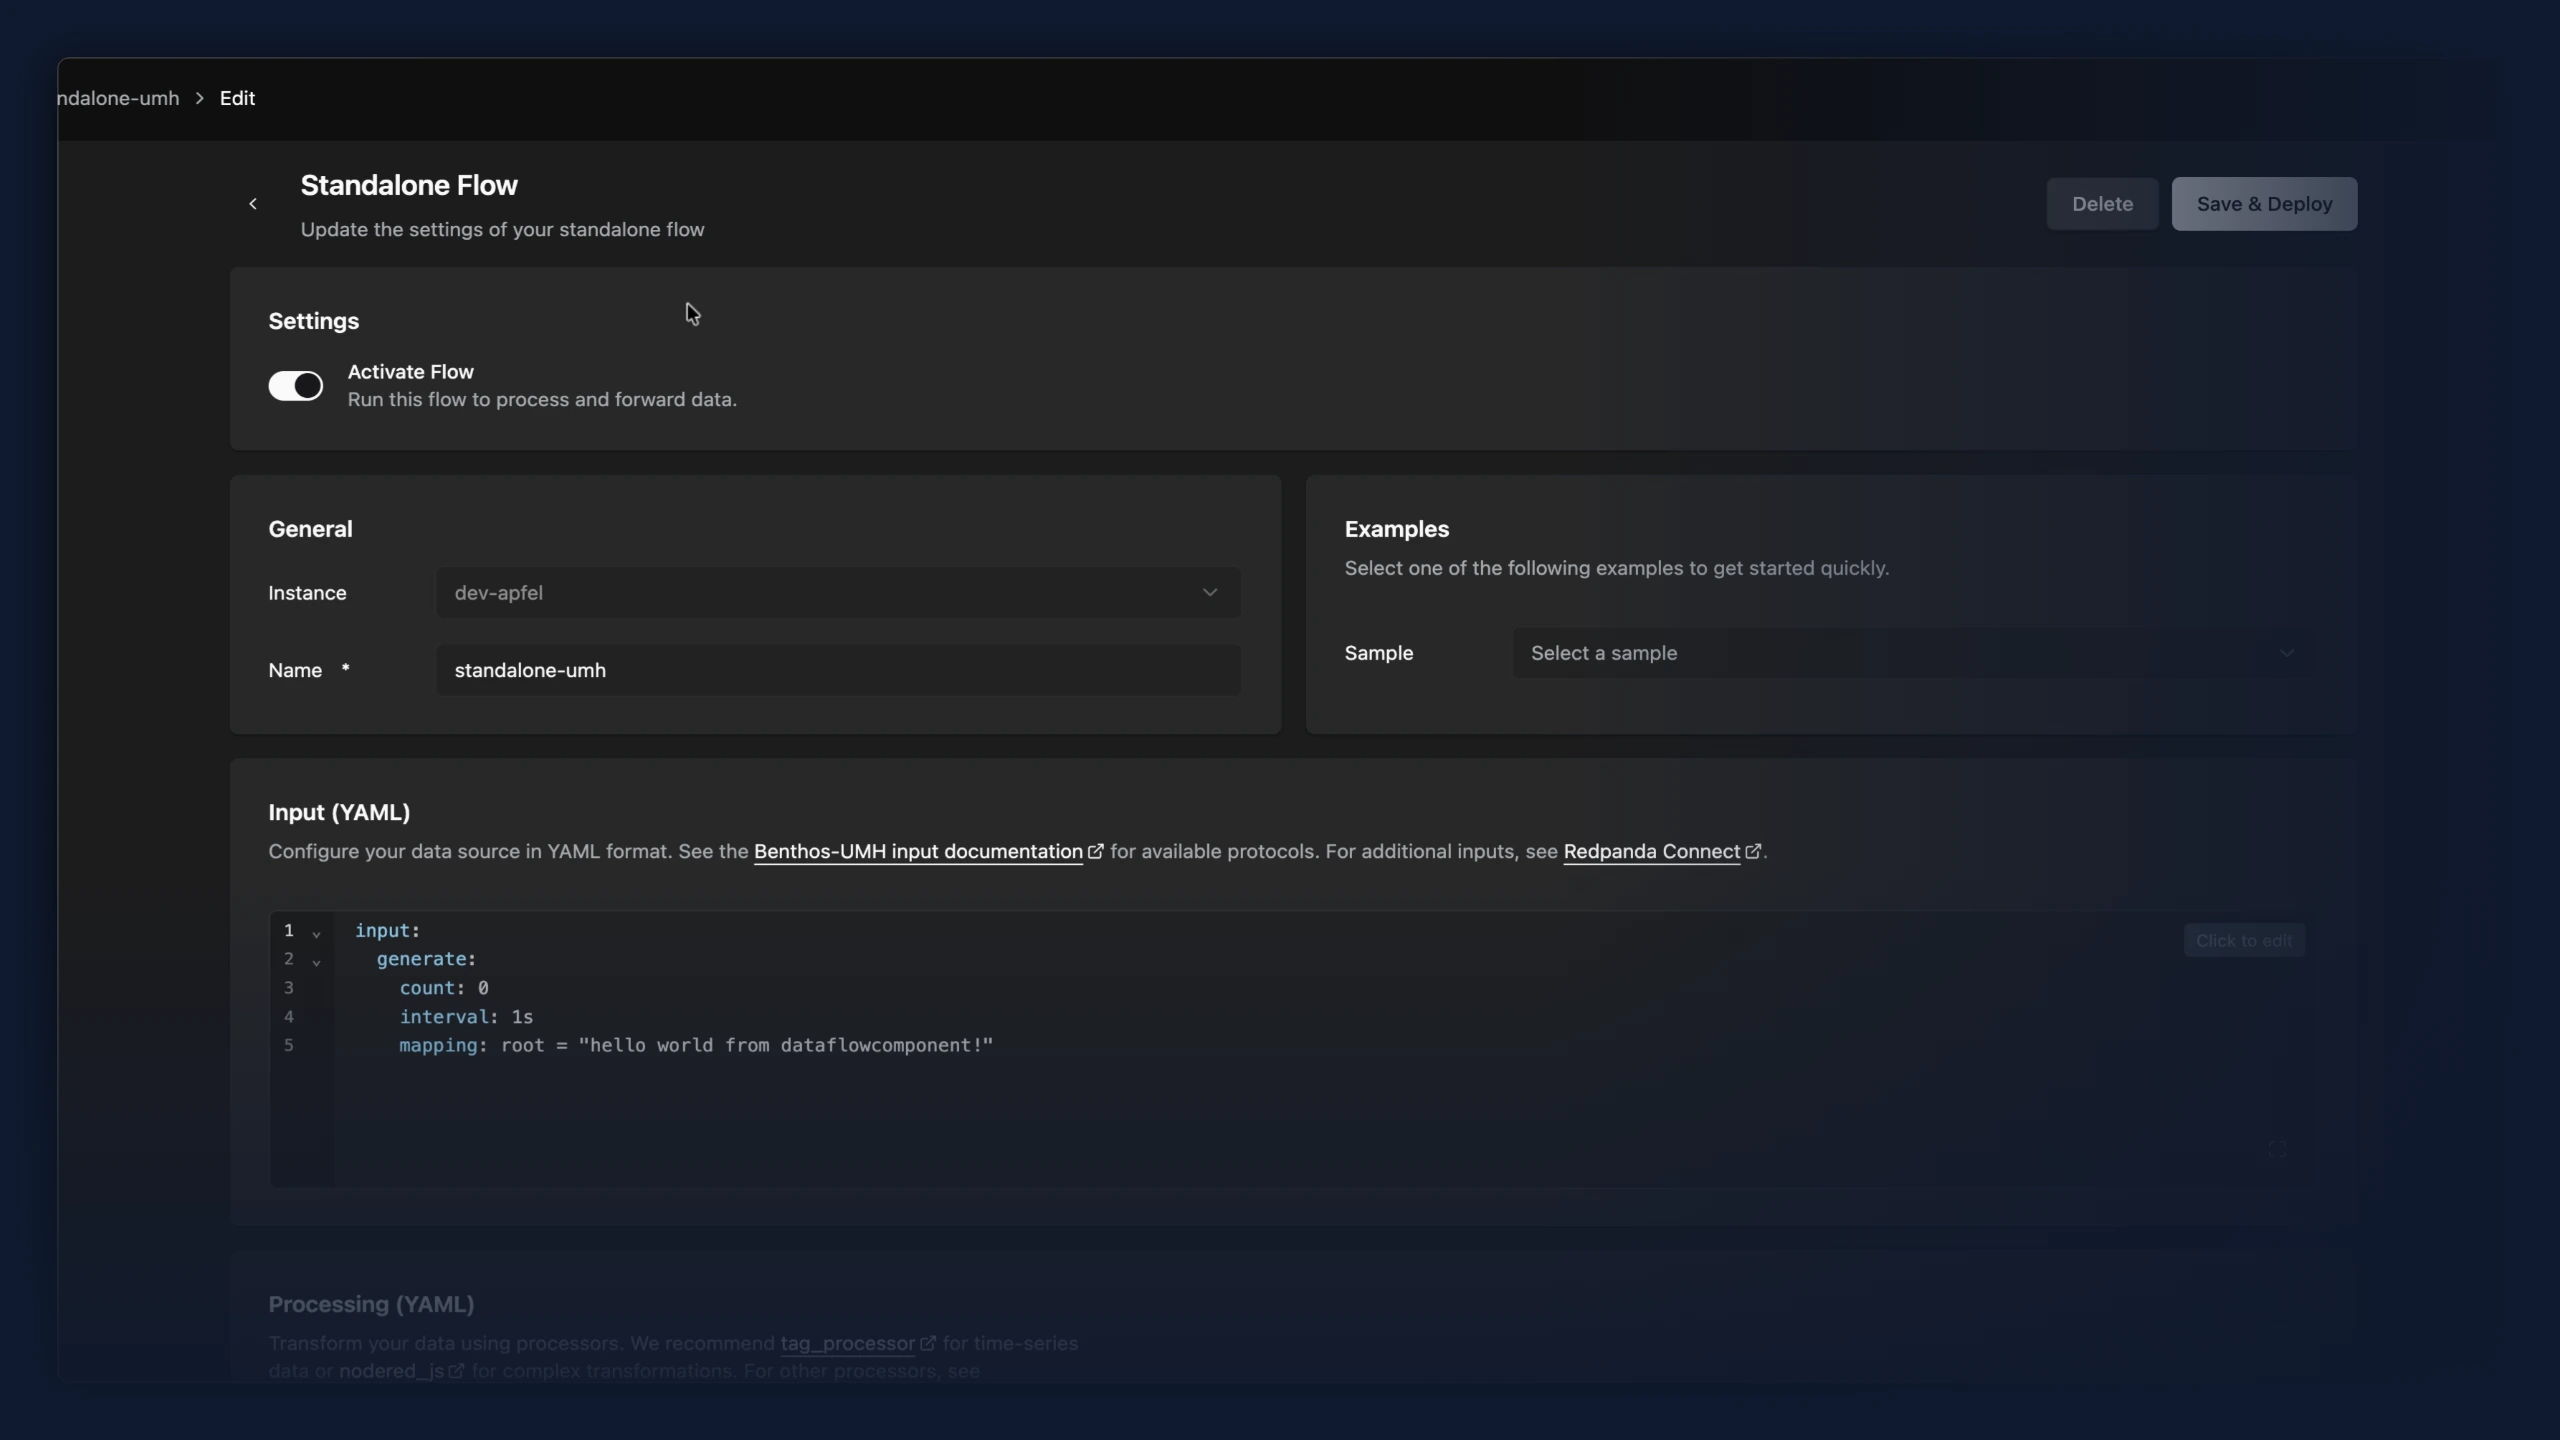
- Standalone data flows now have an overview page and a refreshed editor. Opening a Standalone Flow from the data flow list shows a read-only summary with a live monitoring view. A new "Edit Config" button opens the editor when you want to make changes. The editor now matches the rest of the app with the same cards and spacing. Activating or pausing a flow is now a clear "Activate Flow" toggle in its own card, the same control bridges use, instead of an "Active/Stopped" dropdown.
Improvements
- Data flow type selection (Bridge, Stream Processor, Standalone) now lives only in the Data Flows sidebar sub-navigation. The duplicate tab bar above the data flow list has been removed, since it switched between the same views the sidebar already offers.
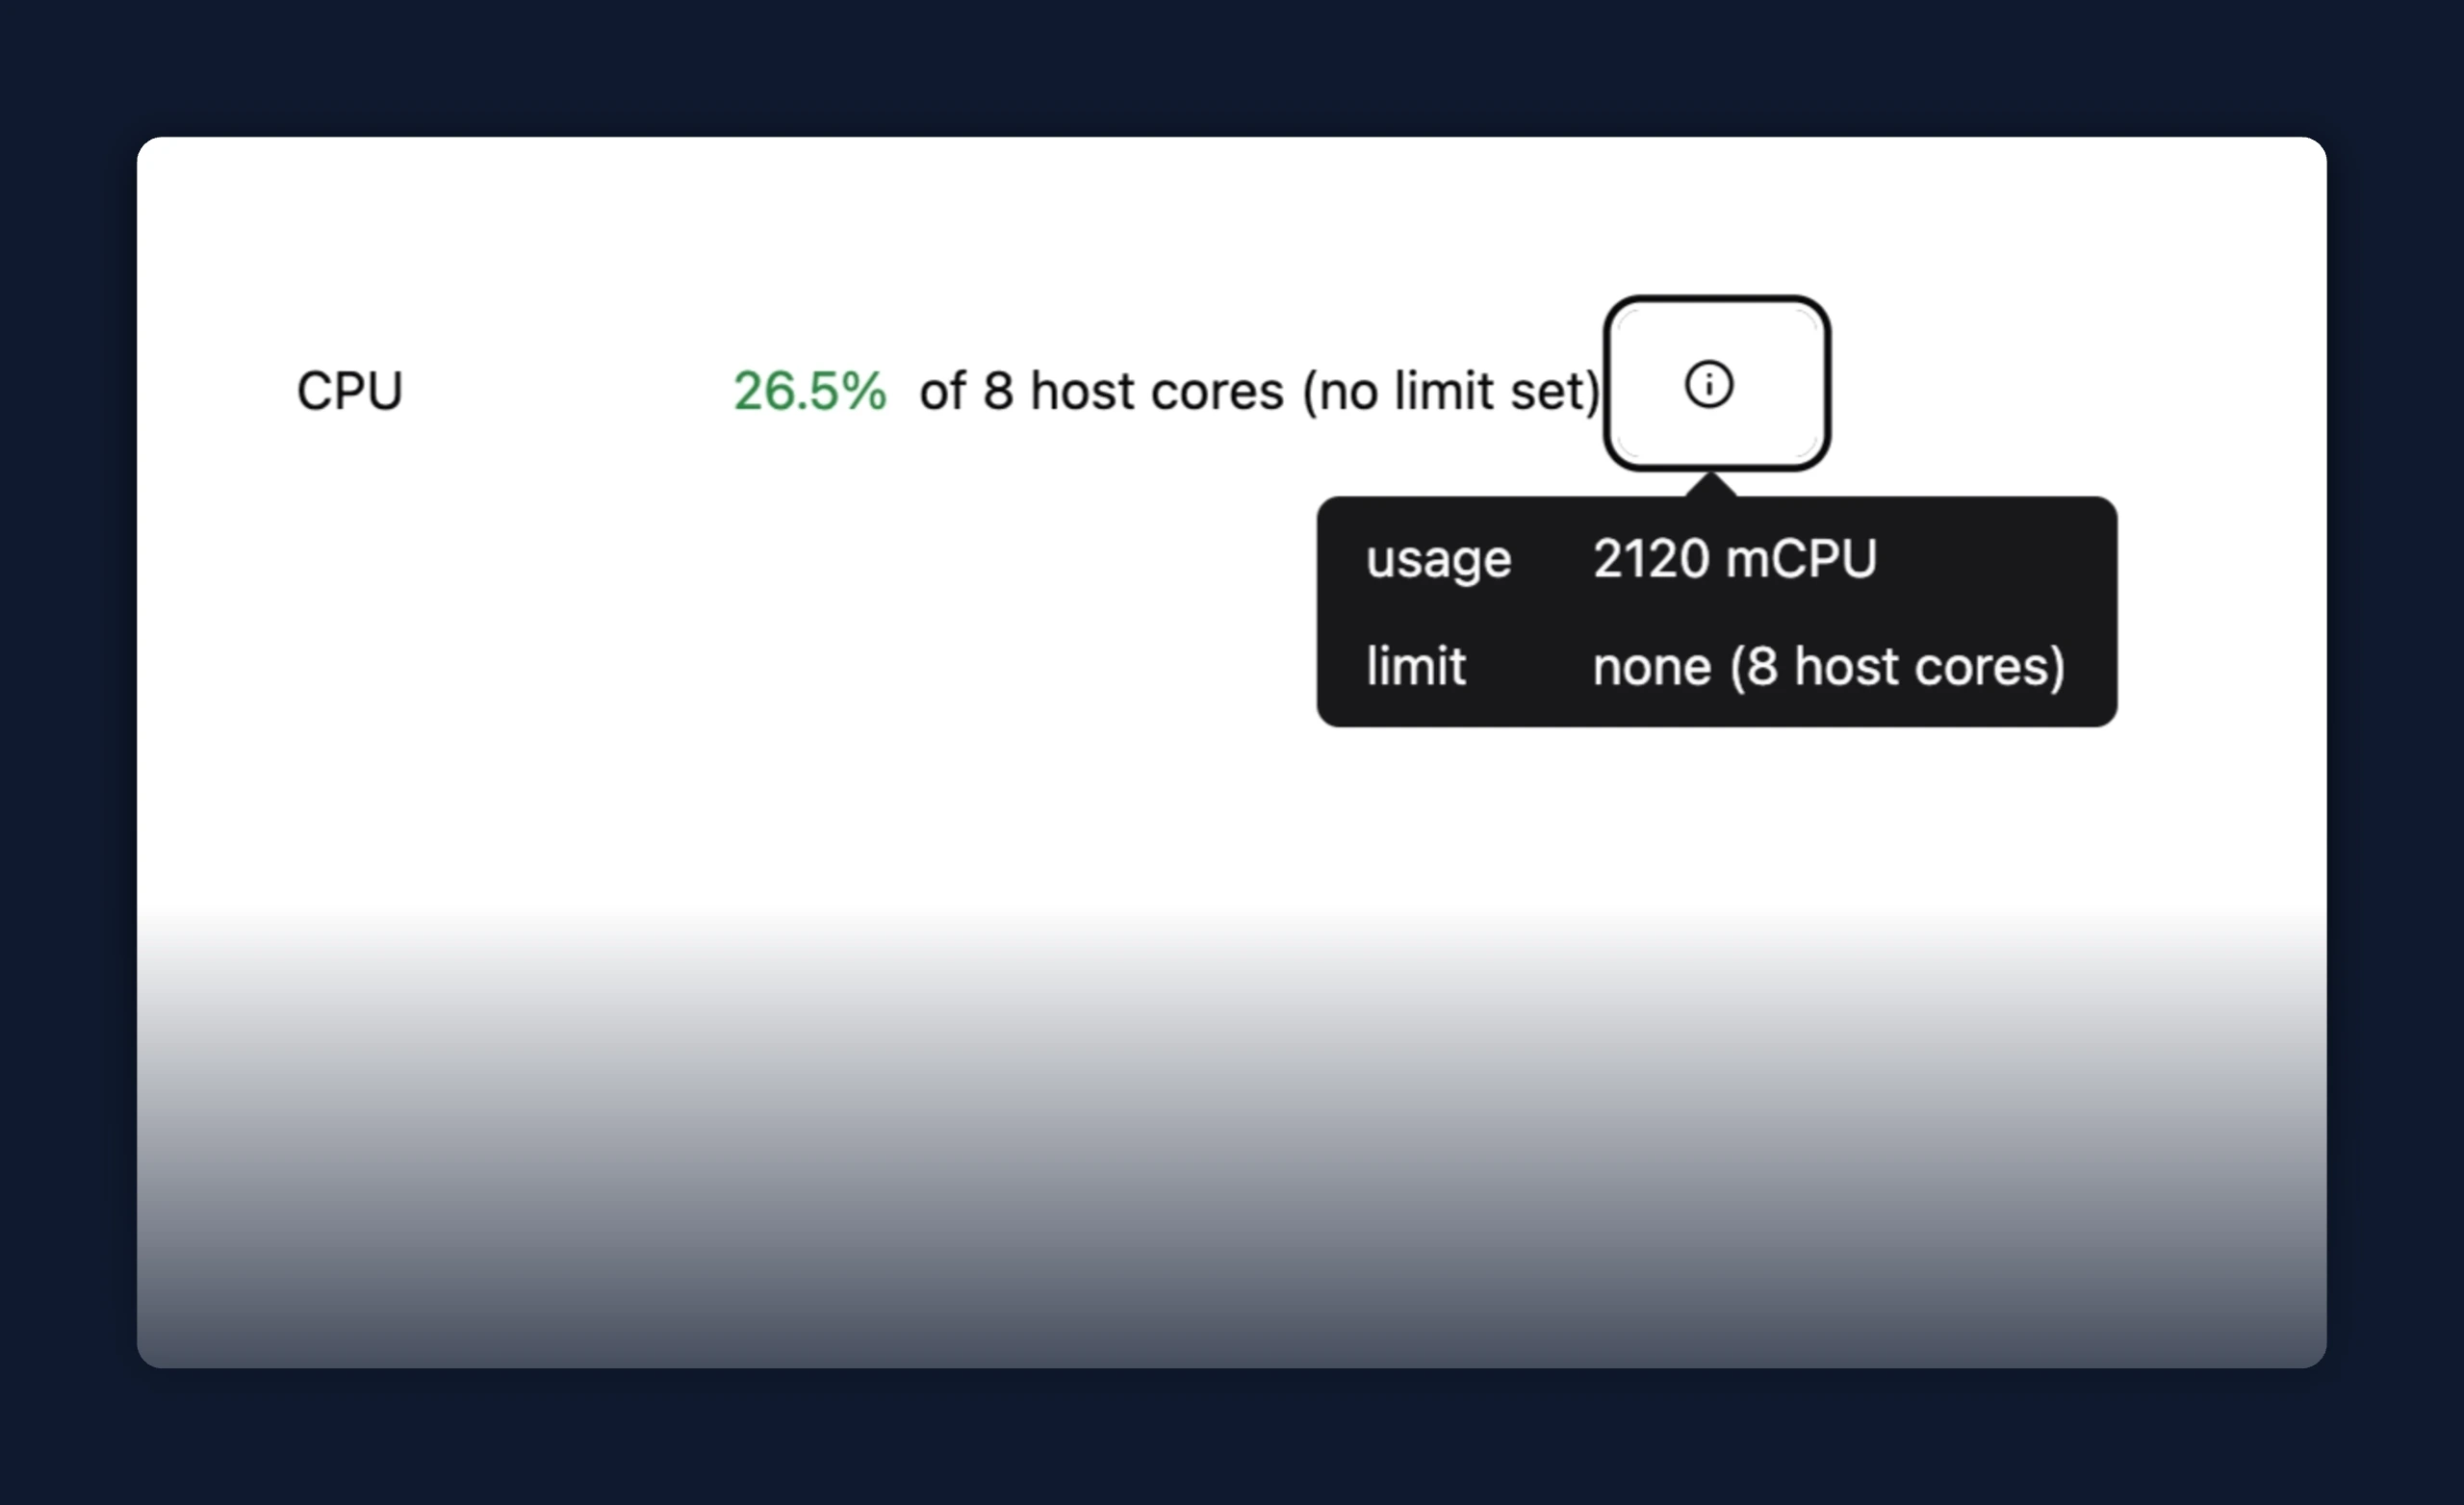
- CPU usage in the instance details row now shows usage against the container's cgroup limit when one is set (for example, 1850 / 2000 mCPU), instead of as a percentage of all host cores.
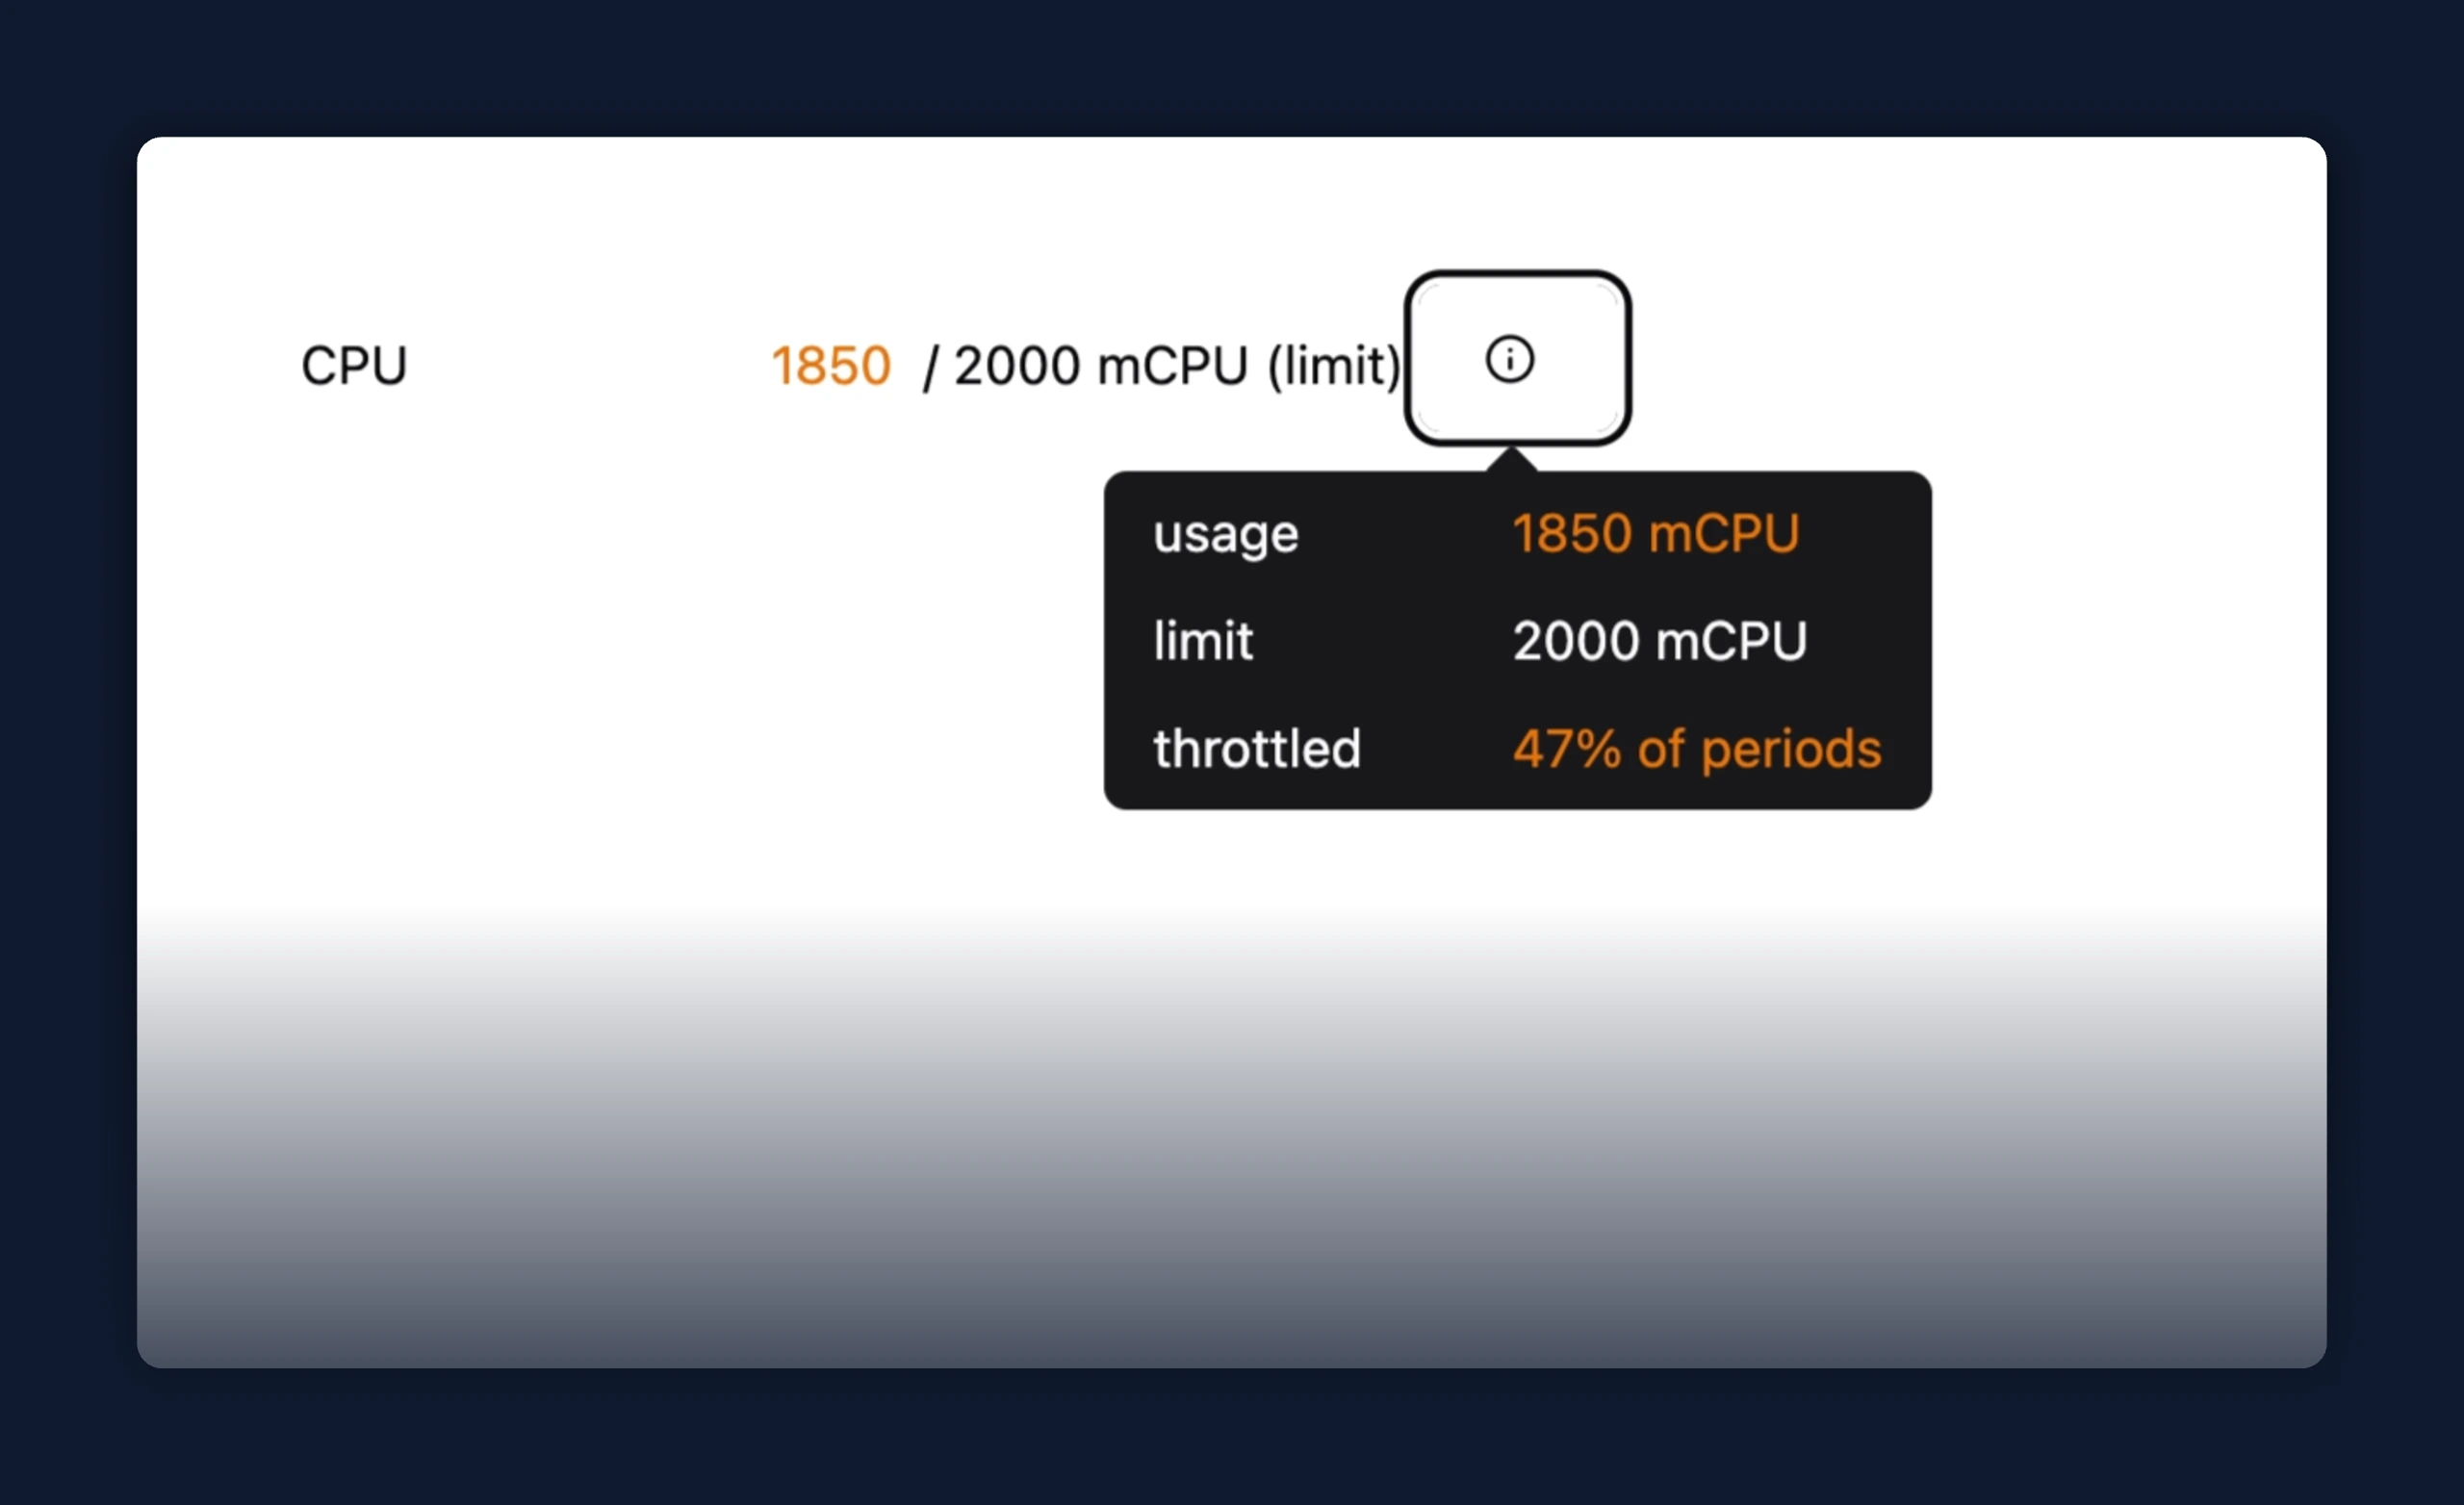
- Hovering the CPU row opens a metrics tooltip with usage, limit, and throttle breakdown.
Fixes
- Sparkplug B bridges now show every metric in the Topic Browser, including ones that never change after startup. A Sparkplug device announces each metric's initial value once and then only reports later changes, but the default template ignored those initial announcements, so any metric that stayed constant never appeared; initial values now come through and seed each topic, with later changes updating it in place